March 2023
- 08 May 2024
- Print
- DarkLight
- PDF
March 2023
- Updated on 08 May 2024
- Print
- DarkLight
- PDF
Article Summary
Share feedback
Thanks for sharing your feedback!
Scopes Overview Graph
A new graph presenting an overview of all of your scopes has been released. The Scopes Overview graph shows you all of the Groups in your organization, how many critical Findings each Scope/Group has, the total Findings divided by severity, and more. This graph provides you an easy way to see which Scopes/Groups in your organization have the most activity, which are being hit the hardest with potentially dangerous attacks, and more.
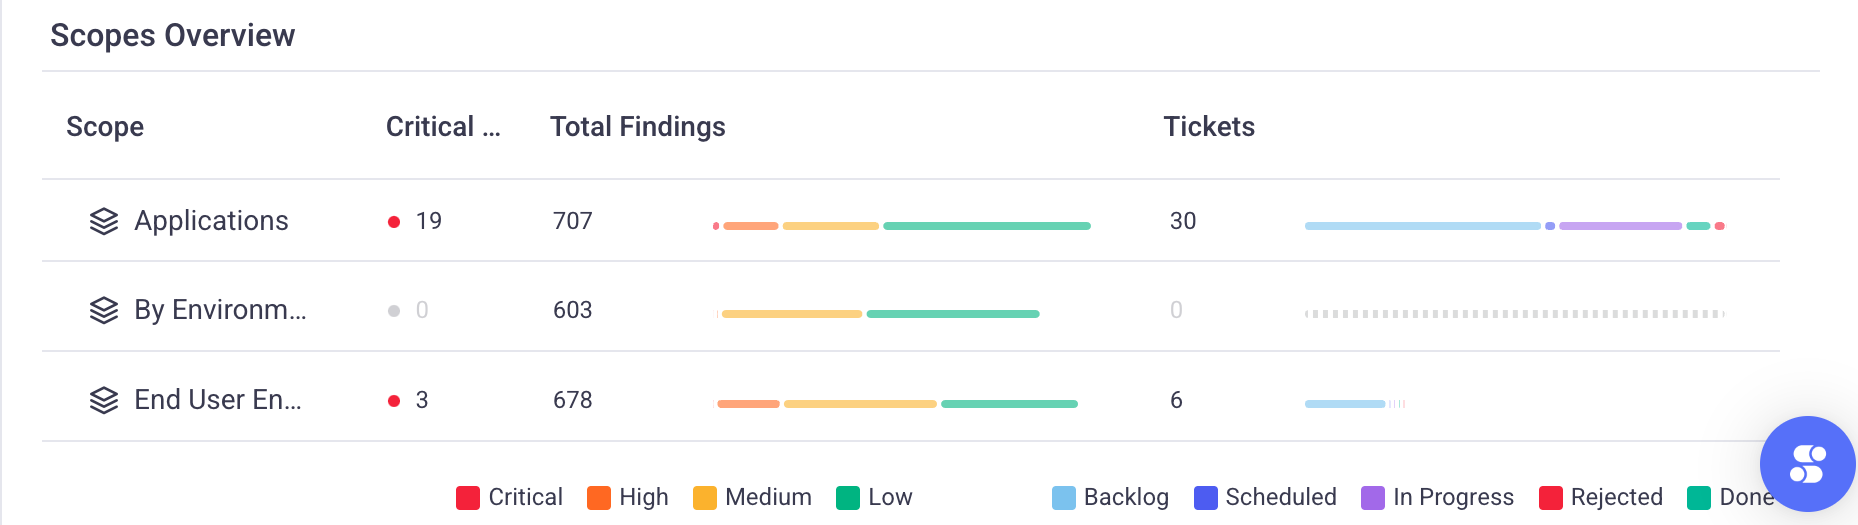
In addition, you can see which of your teams has resolved the most tickets, which have the largest backlog, etc.